[Python Machine Learning] 5. 분류: 앙상블 & 랜덤 포레스트
1. 앙상블
일련의 예측기(분류, 회귀 모델)로부터 예측을 수집하여 가장 좋은 모델 하나보다 더 좋은 예측을 얻을 수 있는 일련의 예측기 혹은 학습 방법론이다. 별도의 노력 없이 더 좋은 모델을 만들 수 있으며, 주로 Feature Engineering을 사용할 수 없는 경우 혹은 Feature에 대한 정보가 없는 경우 사용한다.
사용되는 모델은 서로 차별성이 존재하는 모델을 선택하여 결합을 통한 효과를 높일 수 있다. 모델 간의 결합은 학습이 완료된 모델들로부터 얻어지는 결과를 각 모델의 특성을 고려하여 효과적으로 결합해야 한다.
앙상블 방식에 대해서는 크게 배깅, 부스팅, 스태킹이 있다.
1) 투표 기반 분류기
더 좋은 분류기를 만드는 가장 간단한 방법은 각 분류기의 예측을 모아 가장 많이 선택된 클래스를 예측하는 것이다. 아래와 같이 다수결 투표로 정해지는 분류기를 직접 투표 분류기라고 한다.
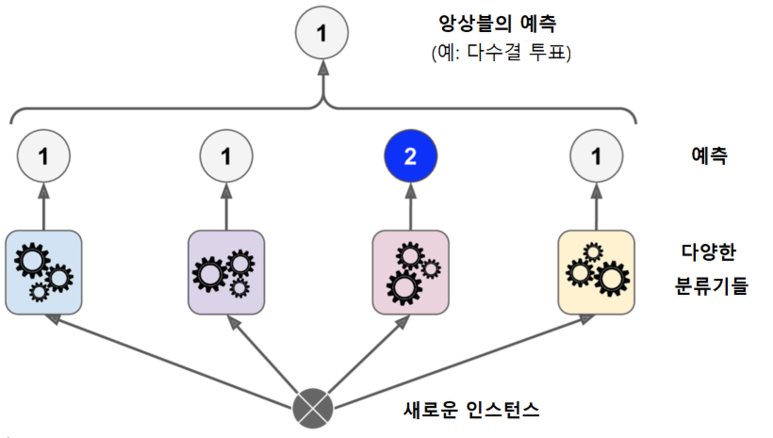
각 분류기가 성능이 낮은 약한 학습기이더라도 충분한 수와 종류가 다양하다면, 강한 학습기가 될 수 있다.
[Python Code]

from sklearn.ensemble import RandomForestClassifier
from sklearn.ensemble import VotingClassifier
from sklearn.linear_model import LogisticRegression
from sklearn.svm import SVC
from sklearn.model_selection import train_test_split

from sklearn.datasets import make_moons

from sklearn.metrics import accuracy_score

x, y = make_moons(n_samples=500, noise=0.30, random_state=42)
x_train, x_test, y_train, y_test = train_test_split(x, y, random_state=42)

log_clf = LogisticRegression(solver='liblinear', random_state=42)
rnd_clf = RandomForestClassifier(n_estimators=10, random_state=42)
svm_clf = SVC(gamma='auto', random_state=42)

## 직접 투표 분류기
voting_clf = VotingClassifier(
    estimators=[('lr', log_clf), ('rf', rnd_clf), ('svc', svm_clf)],
    voting="hard"
)
voting_clf.fit(x_train, y_train)

for clf in (log_clf, rnd_clf, svm_clf, voting_clf):
    clf.fit(x_train, y_train)

y_pred = clf.predict(x_test)
print(clf.__class__.__name__, accuracy_score(y_test, y_pred))
[실행결과]

LogisticRegression 0.864
RandomForestClassifier 0.872
SVC 0.888
VotingClassifier 0.896
위의 코드에서 추가적인 설명으로 현재 scikit-learn 0.22 이상의 버전인 경우 LogisticRegression의 solver 파라미터의 기본 값이 “liblinear” 에서 “lbfgs” 로 변경된다. RandomForestClassifier 의 경우 n_estimators 의 기본값이 100으로 변경되며, SVC의 경우 gamma 파라미터의 기본값이 스케일 조정되지 않은 특성을 위해 “scale” 로 변경된다. 만약 기존방식을 사용하고 경고 메세지를 출력하고 싶지 않은 경우에는 gamma 값을 “auto”로 설정해주면 된다. 위의 실습은 기존의 방식을 사용한다는 가정하에 설정이 이루어진 점을 감안하기 바란다.
앞서 살펴본 분류기 방식과 달리, 모든 분류기가 클래스의 확률을 예측할 수 있으면 개별 분류기의 예측을 평균 내어 확률이 가장 높은 클래스로 예측을 한다. 이와 같이 확률을 이용해, 투표에서 가장 높은 비중을 두는 클래스로 예측하는 방식의 분류기를 간접 투표 분류기 라고 한다. 앞서 언급한 것처럼 확률이 높은 투표에 비중을 더 두기 때문에 직접 투표방식 보다 성능이 높다. 사용방법은 앞선 분류기 파라미터 중 voting 을 “hard” 에서 “soft” 로 변경해주면 된다.
[Python Code]

from sklearn.ensemble import RandomForestClassifier
from sklearn.ensemble import VotingClassifier
from sklearn.linear_model import LogisticRegression
from sklearn.svm import SVC
from sklearn.model_selection import train_test_split

from sklearn.datasets import make_moons

from sklearn.metrics import accuracy_score

x, y = make_moons(n_samples=500, noise=0.30, random_state=42)
x_train, x_test, y_train, y_test = train_test_split(x, y, random_state=42)

log_clf = LogisticRegression(solver='liblinear', random_state=42)
rnd_clf = RandomForestClassifier(n_estimators=10, random_state=42)
svm_clf = SVC(gamma='auto', probability=True, random_state=42)

## 간접 투표 분류기
voting_clf = VotingClassifier(
estimators=[('lr', log_clf), ('rf', rnd_clf), ('svc', svm_clf)],
voting='soft')
voting_clf.fit(X_train, y_train)

for clf in (log_clf, rnd_clf, svm_clf, voting_clf):
    clf.fit(x_train, y_train)

y_pred = clf.predict(x_test)
print(clf.__class__.__name__, accuracy_score(y_test, y_pred))
[실행결과]

LogisticRegression 0.864
RandomForestClassifier 0.872
SVC 0.888
VotingClassifier 0.912
2) 다수결 투표를 사용한 분류 앙상블
앞서 투표 분류기 모델을 간단하게 다뤄봤다. 이번에는 여러가지 분류 모델의 신뢰도에 가중치를 부여하여 연결해 사용하는 알고리즘을 살펴보자. 이번 예제에서의 목표는 특정 데이터셋에서 개별 분류기의 약점을 보완하는 강력한 메타 분류기를 구축하는 것이다. 코드 구현하기에 앞서 간단하게 수학적인 배경지식을 짚고 넘어가기로 하자.
먼저 수학적으로 가중치가 적용된 다수결 투표에 대한 결과는 아래 명시된 식과 같다.
$ \hat{y} = {\argmax} _i \sum _{j=1}^m w_j x_A (C_j (x)=i) $
위의 식에서 명시된 각 변수들에 대한 내용은 다음과 같다.
- C_j : 개별 분류기
- wj : 개별 분류기에 연관된 가중치
- y^ : 앙상블이 예측한 클래스 레이블
- χA : 특성함수
- A : 고유한 클래스 레이블 집합
만약 가중치가 동일하다면 위의 식을 아래와 같이 변형할 수도 있다.
$ \hat{y} = mode{C_1(x),C_2(x), … ,C_m(x)} $
간단한 예시로 세 개의 분류기가 있고 3개 모두 0 또는 1을 예측한다. 이 중 2개는 0을, 나머지 하나는 1을 예측했다고 가정했을 때, 가중치가 동일하다면 아래의 과정에 의해 샘플이 0에 속한다고 예측할 것이다.
$ C_1(x) \to 0, C_2(x) \to 0, C_3(x) \to 1 $
$ \hat{y} = mode{0, 0, 1} = 0 $
하지만, 만약 C3에는 0.6의 가중치를, C1, C2 에는 0.2의 가중치를 부여할 경우에는 다음과 같이 1에 속한다고 예측을 하게 된다.
$ \hat{y}={\argmax} _i \sum _{j=1}^m w_j \varkappa_A (C_j(x)=i) $
$ ={\argmax} _i [0.2 \times i_0 + 0.2 \times i_0 + 0.6 \times i_1]=1 $
위의 예시에서 가중치에 대한 내용만 놓고 보게 되면 C3의 가중치가 나머지 예측기에 3배가되는 가중치가 적용된다고 볼 수 있다. 따라서 앞선과정을 아래의 식과 같이 변형할 수 있다.
$ \hat{y} = mode{0, 0, 1, 1, 1} = 1$
이번에는 위의 내용을 파이썬 코드로 구현해보자.
[Python Code]

import numpy as np
np.argmax(np.bincount([0, 0, 1],
weights=[0.2, 0.2, 0.6]))
[실행결과]

Out[2]: 1
위의 내용을 활용하여 다수결 투표 분류기 클래스를 제작해보자.
[Python Code]

from sklearn.base import BaseEstimator
from sklearn.base import ClassifierMixin
from sklearn.base import clone
from sklearn.preprocessing import LabelEncoder
from sklearn.externals import six
from sklearn.pipeline import _name_estimators
import numpy as np
import operator

class MajorityVoteClassifier (BaseEstimator, ClassifierMixin):
    def __init__(self, classifiers, vote="classlabel", weights=None):
        self.classifiers = classifiers
        self.named_classifiers = {key : value for key, value in _name_estimators(classifiers)}
        self.vote = vote
        self.weights = weights

    def fit(self, x, y):
        self.lablenc_ = LabelEncoder()
        self.lablenc_.fit(y)
        self.classes_ = self.lablenc_.classes_
        self.classifiers_ = []

        for clf in self.classifiers:
            fitted_clf = clone(clf).fit(x, self.lablenc_.transform(y))
            self.classifiers_.append(fitted_clf)

        return self

    def predict(self, x):
        if self.vote == 'probability':
            maj_vote = np.argmax(self.predict_proba(x), axis=1)
        else:
            predictions = np.asarray([clf.predict(x) for clf in self.classifiers_])
            maj_vote = np.apply_along_axis(lambda x : np.argmax(np.bincount(x, weights=self.weights)),
                                           axis=1,
                                           arr=predictions)

        maj_vote = self.lablenc_.inverse_transform(maj_vote)

        return maj_vote

    def predict_proba(self, x):
        probas = np.asarray([clf.predict_proba(x) for clf in self.classifiers])
        avg_proba = np.average(probas, axis=0, weights=self.weights)

        return avg_proba

    def get_params(self, deep=True):
        if not deep:
            return super(MajorityVoteClassifier, self).get_params(deep=False)
        else:
            out = self.named_classifiers.copy()
            for name, step in six.iteritems(self.named_classifiers):
                for key, value in six.iteritems(step.get_params(deep=True)):
                    out['%s__%s' % (name, key)] = value

        return out
이제 만든 클래스를 이용해서 다수결투표분류를 예측해보자. 이번에 사용할 데이터 셋은 붓꽃 데이터(iris) 데이터를 사용하며, 위의 코드를 포함한 전체 코드 및 실행 결과는 다음과 같다.
[Python Code]

## 다수결투표분류기
### 클래스 제작을 위한 라이브러리
from sklearn.base import BaseEstimator
from sklearn.base import ClassifierMixin
from sklearn.base import clone
from sklearn.preprocessing import LabelEncoder
from sklearn.externals import six
from sklearn.pipeline import _name_estimators

### 훈련을 위한 라이브러리
from sklearn import datasets
from sklearn.model_selection import train_test_split
from sklearn.preprocessing import StandardScaler
from sklearn.preprocessing import LabelEncoder

### 모델 생성(분류기 모델만 사용)
from sklearn.model_selection import cross_val_score
from sklearn.linear_model import LogisticRegression
from sklearn.tree import DecisionTreeClassifier
from sklearn.neighbors import KNeighborsClassifier
from sklearn.pipeline import Pipeline

import numpy as np
import operator

class MajorityVoteClassifier (BaseEstimator, ClassifierMixin):
    def __init__(self, classifiers, vote="classlabel", weights=None):
        self.classifiers = classifiers
        self.named_classifiers = {key : value for key, value in _name_estimators(classifiers)}
        self.vote = vote
        self.weights = weights

    def fit(self, x, y):
        self.lablenc_ = LabelEncoder()
        self.lablenc_.fit(y)
        self.classes_ = self.lablenc_.classes_
        self.classifiers_ = []

        for clf in self.classifiers:
            fitted_clf = clone(clf).fit(x, self.lablenc_.transform(y))
            self.classifiers_.append(fitted_clf)

        return self

    def predict(self, x):
        if self.vote == 'probability':
            maj_vote = np.argmax(self.predict_proba(x), axis=1)
        else:
            predictions = np.asarray([clf.predict(x) for clf in self.classifiers_])
            maj_vote = np.apply_along_axis(lambda x : np.argmax(np.bincount(x, weights=self.weights)),
                                           axis=1,
                                           arr=predictions)

        maj_vote = self.lablenc_.inverse_transform(maj_vote)

        return maj_vote

    def predict_proba(self, x):
        probas = np.asarray([clf.predict_proba(x) for clf in self.classifiers_])
        avg_proba = np.average(probas, axis=0, weights=self.weights)

        return avg_proba

    def get_params(self, deep=True):
        if not deep:
            return super(MajorityVoteClassifier, self).get_params(deep=False)
        else:
            out = self.named_classifiers.copy()
            for name, step in six.iteritems(self.named_classifiers):
                for key, value in six.iteritems(step.get_params(deep=True)):
                    out['%s__%s' % (name, key)] = value

        return out

### 사용할 데이터 로드
iris = datasets.load_iris()
x, y = iris.data[50:, [1,2]], iris.target[50:]

### 라벨 인코더 생성
label_encoder = LabelEncoder()
y = label_encoder.fit_transform(y)

### 데이터 셋 분할
x_train, x_test, y_train, y_test = train_test_split(x, y, test_size=0.5, random_state=1, stratify=y)

### 모델 생성
clf1 = LogisticRegression(
    solver="liblinear",
    penalty="l2",
    C=0.001,
    random_state=1
)

clf2 = DecisionTreeClassifier(
    max_depth=1,
    criterion="entropy",
    random_state=0
)

clf3 = KNeighborsClassifier(
    n_neighbors=1,
    p=2,
    metric="minkowski"
)

pipe1 = Pipeline([['sc', StandardScaler()], ['clf', clf1]])
pipe3 = Pipeline([['sc', StandardScaler()], ['clf', clf3]])
clf_labels = ['Logistic Regression', 'Decision Tree', 'KNN']

### 10-Fold 교차검증 과정
print("10-Folds Cross Validation:\n")
for clf, label in zip([pipe1, clf2, pipe3], clf_labels):
    scores = cross_val_score(
        estimator=clf,
        X=x_train,
        y=y_train,
        cv=10,
        scoring='roc_auc'
    )

print("ROC_AUC : %0.2f (+/- %0.2f) [%s]" % (scores.mean(), scores.std(), label))
print("\n")

### 다수결 투표 분류기 생성 및 학습
mv_clf = MajorityVoteClassifier(classifiers=[pipe1, clf2, pipe3])
clf_labels += ['Majority Voting']
all_clf = [pipe1, clf2, pipe3, mv_clf]

for clf, label in zip(all_clf, clf_labels):
    scores = cross_val_score(
                estimator=clf,
                X=x_train,
                y=y_train,
                cv=10,
                scoring='roc_auc'
    )

print("ROC_AUC : %0.2f (+/- %0.2f) [%s]" % (scores.mean(), scores.std(), label))
[실행 결과]

10-Folds Cross Validation:
ROC_AUC : 0.87 (+/- 0.17) [Logistic Regression]
ROC_AUC : 0.89 (+/- 0.16) [Decision Tree]
ROC_AUC : 0.88 (+/- 0.15) [KNN]

ROC_AUC : 0.87 (+/- 0.17) [Logistic Regression]
ROC_AUC : 0.89 (+/- 0.16) [Decision Tree]
ROC_AUC : 0.88 (+/- 0.15) [KNN]
ROC_AUC : 0.94 (+/- 0.13) [Majority Voting]
위의 코드에서 의사결정나무를 제외한 나머지 2개 모델(로지스틱 회귀, KNN)을 파이프라인으로 묶어서 사용한 이유는 2개 모델 모두 스케일에 민감한 모델들이다. 따라서 모델을 생성하기 전에 학습에 사용되는 전반적인 데이터들의 스케일을 동일하게 맞춰서 측정해주는 편이 좋기 때문에 파이프라인을 사용해서 표준스케일모델을 같이 묶어서 사용한 것이다.
(참고로, 특성을 표준화 처리하는 것은 좋은 습관이니 익혀두는 것이 좋습니다. )
코드 실행에 대한 결과를 확인해보면 알 수 있듯이, 같은 10-Fold 교차검증을 실행했음에도 앙상블 기법을 사용한 경우가 가장 높은 성능을 낸다는 것을 확인할 수 있다. 텍스트로만 확인하기에는 잘 와닿지 않기 때문에 ROC Curve 를 시각화하여 한번 더 확인해보자. 코드는 아래와 같다.
[Python Code]

### ROC Curve
from sklearn.metrics import roc_curve
from sklearn.metrics import auc

....

### 학습 결과에 대한 성능평가 (ROC Curve)
colors = ["black", "orange", "blue", "green"]
linestyles = [":", "--", "-.", "-"]
for clf, label, clr, ls in zip(all_clf, clf_labels, colors, linestyles):
y_pred = clf.fit(x_train, y_train).predict_proba(x_test)[:, 1]
fpr, tpr, thresholds = roc_curve(y_true=y_test, y_score=y_pred)
roc_auc = auc(x=fpr, y=tpr)

plt.plot(fpr, tpr, color=clr, linestyle=ls, label='%s (auc = %0.2f)' % (label, roc_auc))
plt.legend(loc="lower right")
plt.plot([0, 1], [0, 1], linestyle="--", color="gray", linewidth=2)
plt.xlim([-0.1, 1.1])
plt.ylim([-0.1, 1.1])
plt.grid(alpha=0.5)
plt.xlabel("False Positive Rate(FPR)")
plt.ylabel("True Positive Rate(FPR)")
plt.show()
[실행 결과]
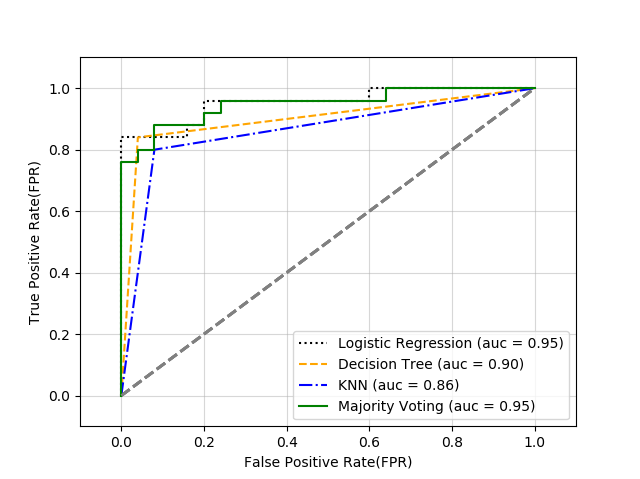
위의 ROC 곡선을 통해서도 확인할 수 있듯이, 앙상블 분류기가 다른 모델들에 비해서 높은 성능을 낸다는 것을 다시 한 번 확인할 수 있다. 특이 사항으로 로지스틱 함수가 앙상블 모델과 동일한 성능을 내는 것으로 볼 수 있는데, 그 이유는 데이터 셋 자체가 작았고, 그로 인해 데이터의 분산 자체가 높아지기 때문에 로지스틱 회귀를 사용하게 되는 경우 높은 성능을 나타낸다고 설명할 수 있다. (단, 어떻게 데이터 셋을 나누었는지에 민감한 모델이 생성된다.)
2. 배깅 & 페이스팅
배깅과 페이스팅 모두 같은 알고리즘을 사용하지만 훈련 세트의 서브셋을 무작위로 구성하여 분류기를 각각 다르게 학습 시킨 후 앙상블하는 방식이며, 차이점으로는 훈련 세트의 중복을 허용하여 샘플링하는 방식을 배깅, 중복 혀용을 안하고 샘플링하는 방식을 페이스팅 이라고 한다.
모든 예측기가 훈련을 마치면 각 예측기에서 나온 예측을 모아 새로운 샘플에 대한 예측을 생성한다. 이 때, 문제가 만약 분류에 대한 것이라면, 통계적 최빈값을, 회귀에 대한 것이라면, 평균을 계산한다.
일반적으로 앙상블의 결과는 원본 데이터 셋을 하나의 예측기를 훈련 시킬 때와 편향은 비슷하지만 분산은 줄어든다.
1) 배깅 알고리즘 동작 방식
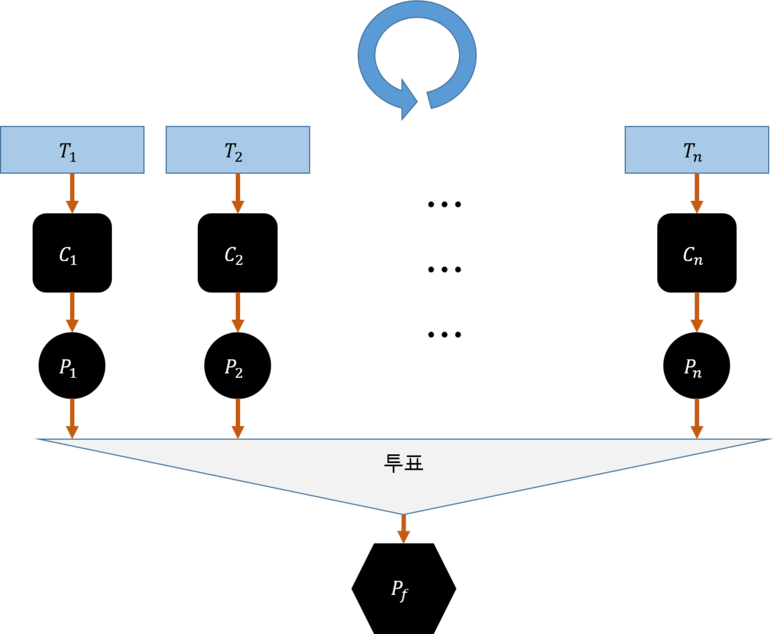
동작 방식은 아래 그림과 같다. 구체적으로 살펴보면 배깅 단계마다 중복을 허용하여 랜덤하게 샘플링된다. 각각의 부트스트랩 샘플을 사용해 분류기를 학습하게 되며, 일반적으로는 가지치기하지 않은 결정트리를 분류기로 사용한다.
각 분류기에서는 훈련 세트로부터 추출한 랜덤한 부분 집합을 이용한다. 중복을 허용한 샘플링을 사용하기 때문에 각 부분집합에는 일부가 중복되어있고, 원본으로부터 일부는 아예 샘플링되지 않는 경우가 있다.
샘플링을 통해 분류기가 학습을 완료하면 다수결 투표를 사용해 예측을 모은다.
2) Scikit-Learn 에서의 배깅 & 페이스팅
사이킷 런에서의 배깅은 BaggingClassifier() (회귀인 경우에는 BaggingRegressor() ) 를 사용한다.
사용되는 매개변수들은 다음과 같다.
BaggingClassifier(
    모델,
    n_estimators = m,   # 예측기 숫자
    max_samples = n,    # 샘플 데이터 수
    bootstrap = True,   # 중복 허용 여부
                        # 페이스팅 사용할 경우 False로 설정
    n_jobs = k          # 훈련과 예측에서 사용될 CPU 코어 수
)
[Python Code]

from sklearn.ensemble import BaggingClassifier
from sklearn.tree import DecisionTreeClassifier
from sklearn.model_selection import train_test_split
from sklearn.datasets import make_moons

from sklearn.metrics import accuracy_score

x, y = make_moons(n_samples=500, noise=0.30, random_state=42)
x_train, x_test, y_train, y_test = train_test_split(x, y, random_state=42)

bag_clf = BaggingClassifier(
    DecisionTreeClassifier(),
    n_estimators=500,
    max_samples=100,
    bootstrap=True,
    n_jobs=1
)

bag_clf.fit(x_train, y_train)
y_pred = bag_clf.predict(x_test)

print(accuracy_score(y_test, y_pred))

tree_clf = DecisionTreeClassifier(random_state=42)

tree_clf.fit(x_train, y_train)
y_pred_tree = tree_clf.predict(x_test)

print(accuracy_score(y_test, y_pred_tree))
위의 코드를 실행해 결과를 비교해보면 확실히 배깅으로 예측한 결과가 단순히 의사결정나무로 만든 예측보다 더 정확하다는 것을 알 수 있다.
추가적으로 시각화를 통해서 확인해보면 아래 그림과 유사한 결과를 얻을 수 있다.
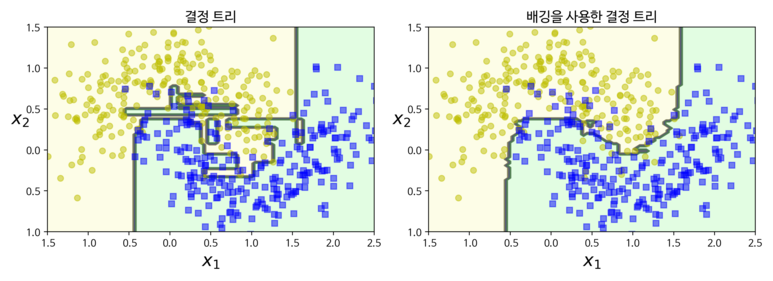
위의 그림에서도 알 수 있듯이, 결정 경계가 배깅으로 만들었을 때 좀 더 일반화가 잘 됬다는 것을 알 수 있다.
부트 스트래핑의 경우 각 예측기가 학습하는 서브셋에 다양성을 증가시키므로 배깅이 페이스팅 보다 편향이 좀 더 높은 편이다. 이는 예측기들의 상관관계를 줄여 결과적으로 앙상블의 분산이 감소하게 된다.
3) OOB 평가
배깅을 사용해 학습을 한다고 할 경우, 하나의 예측기를 학습시키는 과정에서 어떤 데이터는 여러 번 샘플링이 되고, 어떤 데이터는 아예 샘플링이 되지 못하는 경우도 발생한다. 일반적으로 BaggingClassifier를 사용할 때, 중복허용을 하여 훈련 세트의 크기만큼 n 개의 샘플을 선택하도록 한다. 예를 들어 샘플링 된 정도가 전체 데이터 중에 60% 정도를 사용했다고 가정해보자. 이 때 사용되지 못한 40%의 데이터를 OOB(Out of Bag) 샘플이라고한다.
훈련에서 사용되지 못했기에, 예측기가 훈련을 마친 후 평가용 데이터로 사용할 수 있다. 앙상블의 평가는 각 예측기의 OOB 평가를 모아 평균을 낸 수치로 계산한다.
사이킷 런에서 OOB 를 사용하기 위해서는 모델 생성 시 옵션으로 oob_score=True 로 설정하면 사용할 수 있다. 평가 점수는 oob_score_ 변수에 저장되어 있다. 사용할 데이터는 iris 데이터 셋이다.
[Python Code]

bag_clf = BaggingClassifier(
    RandomForestClassifier(),
    n_estimators=500,
    bootstrap=True,
    n_jobs=1,
    oob_score=True
)

bag_clf.fit(x_train, y_train)

print(str(round(bag_clf.oob_score_, 4)*100) + "%")  # 94.64%
위의 코드를 실행한 결과, 해당 모델의 OOB 평가는 94.64% 정도의 정확도를 얻은 것을 확인할 수 있다. 이 결과와 정확도와 비교해보자.
[Python Code]

y_pred = bag_clf.predict(x_test)
accuracy_score(y_test, y_pred) #  1.0
정확도 100%라는 결과가 나왔다. 확실하게 좋은 것인지 확인하고자, 의사결정나무 분류기 모델로 대체했을 때의 결과와 비교해보겠다.
[Python Code]

bag_clf = BaggingClassifier(
    DecisionTreeClassifier(),\
    n_estimators=500,\
    bootstrap=True,\
    n_jobs=1,\
    oob_score=True
)

bag_clf.fit(x_train, y_train)
print(str(round(bag_clf.oob_score_, 4)*100) + "%")  # 95.54%

y_pred = bag_clf.predict(x_test)
accuracy_score(y_test, y_pred) #  1.0
추가적으로 OOB 샘플에 대한 결정함수의 값도 확인할 수 있다. 모델을 생성한 후 oob_decision_function_ 변수에 저장이 되며, 결정함수는 각 훈련 샘플의 클래스 확률을 반환해준다. 예시로 방금 전에 생성한 의사결정나무 기반 모델의 결정함수 값을 확인해보자.
[Python Code]

bag_clf.oob_decision_function_
[실행 결과]

array([[1.        , 0.        , 0.        ],
[1.        , 0.        , 0.        ],
[0.        , 0.        , 1.        ],
[0.        , 0.90384615, 0.09615385],
[0.        , 1.        , 0.        ],
.....
[0.        , 0.02986279, 0.97013721],
[1.        , 0.        , 0.        ],
[0.        , 1.        , 0.        ],
[0.        , 0.86705277, 0.13294723],
[1.        , 0.        , 0.        ],
[0.        , 1.        , 0.        ],
[0.        , 0.        , 1.        ]])
4) Random Forest
랜덤 포레스트란 의사결정나무의 앙상블 모형으로, 여러 개의 의사결정나무를 평균을 내는 것이다. 각 나무별로 분산이 높다는 단점이 있지만 앙상블 기법을 이용함으로써 견고한 모델을 만들고, 일반화 성능을 높이며, 과대적합의 위험을 줄여준다.
학습 단계는 크게 4단계로 볼 수 있으며, 아래의 과정과 같다.
① n 개의 랜덤한 부트스트랩 샘플을 추출한다.
② 추출된 샘플을 이용해 의사결정나무를 학습한다.
이 때, 중복을 허용하지 않고 랜덤하게 d 개의 특성을 선택하고,
정보 이득 등의 목적 함수를 기준으로 최선의 분할을 만드는 특성을
사용하여 노드를 분할한다.
③ ① 과 ② 를 반복한다.
④ 각 트리별 예측을 모아 다수결 투표로 클래스 레이블을 선정한다.
랜덤 포레스트는 의사결정나무만큼 해석이 쉽지 않지만, 하이퍼파라미터 튜닝에 크게 노력하지 않아도 된다.
신경 써야되는 파라미터는 랜덤 포레스트가 생성하는 나무 개수이며, 나무의 수가 많을 수록 계산 비용이 증가하게되고 결과적으로 분류기의 성능이 좋아진다.
그 외에도 편향-분산 트래이드 오프를 조절할 수 있는 부트스트랩 크기와 각 분할에서 무작위로 선택할 특성 개수가 주요 변수라고 할 수 있다.
만약 부트스트랩 샘플 크기가 작아지면 개별 트리의 다양성이 증가하게 된다. 이는 무작위성이 증가하는 것과 연관이 있고 결과적으로 과대적합의 영향이 줄어드는 효과를 부른다. 하지만 샘플의 크기가 작을 수록 모델의 전체적인 성능도 줄어든다. 훈련 성능과 테스트 성능의 격차를 줄일 수 있는 만큼, 전체적인 테스트 성능 또한 감소하기 때문이다. 반대로 부트스트랩 샘플 크기가 증가하면, 개별 의사결정나무와 부트 스트랩 샘플이 서로 비슷해지기 때문에, 과대적합 가능성이 증가한다.
사이킷 런에서 랜덤 포레스트 사용법은 다음과 같다.
[Python Code]

from sklearn.ensemble import RandomForestClassifier
from sklearn import datasets
from sklearn.model_selection import train_test_split

from sklearn.metrics import accuracy_score

iris = datasets.load_iris()

x = iris.data[:, [2, 3]]
y = iris.target

x_train, x_test, y_train, y_test = train_test_split(x, y, random_state=42)

model_forest = RandomForestClassifier(criterion="gini", n_estimators=25, random_state=1, n_jobs=2)
model_forest.fit(x_train, y_train)
y_pred = model_forest.predict(x_test)

print(accuracy_score(y_test, y_pred))
[실행 결과]
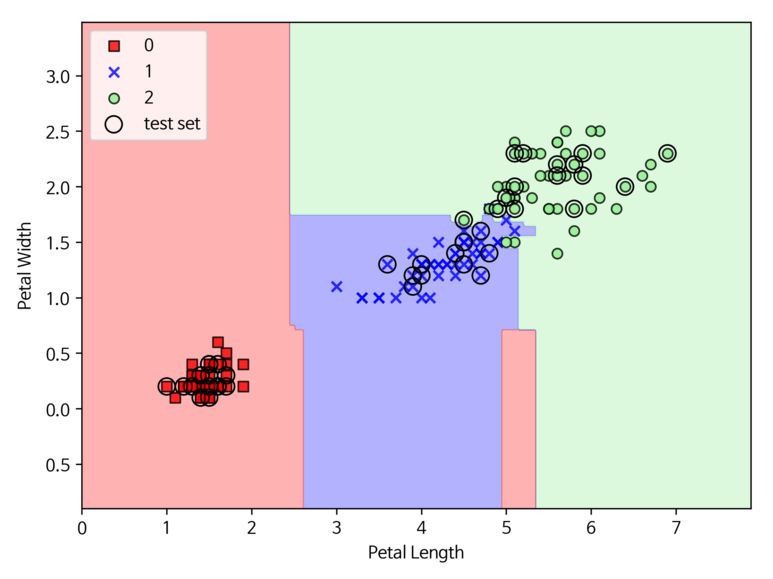
사이킷런의 RandomForestClassifier를 포함해 대부분의 라이브러리에서는 부트스트랩 샘플 크기를 원본 훈련 세트의 샘플 개수와 동일하게 한다. 이유는 균형 잡힌 편향-분산 트래이드 오프를 얻을 수 있기 때문이다. 분할에 사용할 특정 개수 d는 훈련 데이터 에 있는 전체 특성의 수보다 작게 지정하는 경우가 많다. 사용하기에 가장 적정 값은 아래와 같이 설정해주는 것이 좋다.
$ d =\sqrt{m} $
5) Extra Tree
앞서 언급한 대로 랜덤 포레스트 기법을 사용할 때, 각 노든느 무작위로 특성의 서브셋을 만들어 분할에 사용한다. 이 때 트리를 더 무작위하게 만들기 위해서 최적의 임계값을 찾는 대신 후보 특성을 사용해 무작위로 분할하고 그중에서 최상의 분할을 찾는 기법이며, 편향은 늘어나지만 분산이 낮아지게 된다.
scikit-learn 에서는 ExtraTreeClassifier() 와 ExtraTreeRegressor() 를 사용하면되고 사용법은 RandomForestClassifier() RandomForestRegressor() 와 동일하다.
3. 부스팅
부스팅에서 앙상블은 매우 간단한 분류기로 구성이 된다. 이를 보고 “약한 분류기” 라고 하며, 대표적은 예로는 깊이가 1인 의사결정나무라고 할 수 있다.
부스팅의 목적은 분류하기 어려운 훈련 샘플에 초점을 맞추는 것이기 때문에 잘못 분류된 훈련 샘플을 그 다음 학습기가 학습하여 성능을 향상시키는 것이다.
배깅과 달리 부스팅은 중복을 허용하지 않고 훈련 세트에서 랜덤 샘플을 추출하여 부분 집합을 구성한다.
1) AdaBoosting
AdaBoosting은 약한 학습기를 훈련할 때 훈련 세트 전체를 사용한다. 훈련 샘플은 반복될 때마다 가중치가 다시 부여된다. 이런 식으로 이전 모델이 과소적합했던 훈련 샘플의 가중치를 높임으로써 새로운 예측기가 학습하기 어려운 샘플에 점점 더 맞춰지는 방식이다. 하지만 분산과 편향을 감소시킬 수 있어 과대적합이 되기 쉽다는 단점이 있다.
AdaBoosting의 과정은 다음과 같다.
① 가중치 벡터 w 를 동일한 가중치로 설정한다.
② m번의 부스팅 반복을 하면서 아래의 내용을 수행한다.
ⅰ. 가중치가 부여된 약한 학습기를 훈련한다.
ⅱ. 클래스 레이블을 예측한다.
ⅲ. 가중치가 적용된 에러율을 계산한다.
ⅳ. 학습기 가중치를 계산한다.
ⅴ. 가중치를 업데이트한다.
ⅵ. 합이 1이 되도록 가중치를 정규화한다.
③ 최종 예측을 계산한다.
실제로 예제를 보면서 앞선 과정을 살펴보자. 예를 들어 아래와 같은 10개의 훈련 샘플이 있다고 가정해보자.
| index | x | y_real | w | y_pred | is_True | update_w |
|---|---|---|---|---|---|---|
| 1 | 1.0 | 1 | 0.1 | 1 | Yes | 0.072 |
| 2 | 2.0 | 1 | 0.1 | 1 | Yes | 0.072 |
| 3 | 3.0 | 1 | 0.1 | 1 | Yes | 0.072 |
| 4 | 4.0 | -1 | 0.1 | -1 | Yes | 0.072 |
| 5 | 5.0 | -1 | 0.1 | -1 | Yes | 0.072 |
| 6 | 6.0 | -1 | 0.1 | -1 | Yes | 0.072 |
| 7 | 7.0 | 1 | 0.1 | -1 | No | 0.167 |
| 8 | 8.0 | 1 | 0.1 | -1 | No | 0.167 |
| 9 | 9.0 | 1 | 0.1 | -1 | No | 0.167 |
| 10 | 10.0 | -1 | 0.1 | -1 | Yes | 0.072 |
위의 표에서 알 수 있듯이, 레이블 예측 단계까지 진행되었다는 것을 알 수 있다.
가장 먼저 가중치의 에러율을 먼저 계산해보자. 식과 그에 대한 결과는 다음과 같다.
$ \epsilon = 0.1 \times 0 + 0.1 \times 0 + 0.1 \times 0 + 0.1 \times 0 + 0.1 \times 0 + 0.1 \times 0 + 0.1 \times 1 + 0.1 \times 1 + 0.1 \times 1 + 0.1 \times 0 $
$ = \frac {3} {10} = 0.3 $
그 다음 단계로 학습기의 가중치를 계산해보자.
이는 다음 단계인 가중치 업데이트 과정과 마지막 단계인 다수결 투표 예측을 위한 가중치로 사용된다.
$ a_j = 0.5 \log { ( { \frac {1 - \epsilon} { \epsilon } } ) } \approx 0.424 $
가중치의 계산이 완료됬다면, 다음으로 할 작업은 아래의 식을 이용해 가중치를 업데이트 해주는 작업이 필요하다.
$ w\doteqdot w \times \exp (- \alpha_j \times \hat{y} \times y) $
위의 식에서 y^ x y 부분은 예측 클래스 레이블 벡터와 실제 레이블 벡터 간의 원소별 곱셈이다. 만약 예측이 맞다면 원소 곱셈 결과는 양의 결과가 되고 α 값도 양수가 되므로 전체적인 가중치는 감소하게 된다. 반면 예측이 틀린 경우에는 값이 증가하게 된다. 위의 예시로 표현하면 각각 다음과 같다.
$ 0.1 \times \exp (-0.424 \times 1 \times 1 ) \approx 0.065 $
$ 0.1 \times \exp (-0.424 \times 1 \times (-1) ) \approx 0.153 $
마지막으로 가중치의 합이 1이 되도록 정규화를 해준다.
$ w \doteqdot \frac {w} {\sum _{i} w_i} $
위의 예시에 대한 정규화과정 및 결과는 다음과 같다.
$ w \doteqdot \frac {w} {7 \times 0.065 + 3 \times 0.153} = \frac {w} {0.914} $
이제 위의 과정들을 파이썬 코드로 구현해보자. 사용할 데이터 셋은 wine 데이터 셋을 사용하며, base_estimator 속성으로 깊이가 1인 의사 결정 나무를 전달하여 나무 500그루로 구성된 분류기를 학습시킨다.
[Python Code]

from sklearn.ensemble import AdaBoostClassifier
from sklearn.tree import DecisionTreeClassifier
from sklearn.preprocessing import LabelEncoder
from sklearn.model_selection import train_test_split
from sklearn.metrics import accuracy_score

import pandas as pd

dataset = pd.read_csv("https://archive.ics.uci.edu/ml/machine-learning-databases/wine/wine.data", header=None)
dataset.columns = ["Class label", "Alcohol", "Malic acid", "Ash", "Alcalinity of ash", "Magnesium", "Total phenols", "Flavanoids", "Nonflavanoids phenols", "Proanthocyanins", " Color intensity", "Hue", "OD280/OD315 of diluted wines", "Proline"]

dataset = dataset[dataset["Class label"] != 1]
y = dataset["Class label"].values
x = dataset[["Alcohol", "OD280/OD315 of diluted wines"]].values

le = LabelEncoder()
y = le.fit_transform(y)

x_train, x_test, y_train, y_test = train_test_split(x, y, test_size=0.2, random_state=1, stratify=y)

tree = DecisionTreeClassifier(criterion="entropy", random_state=1, max_depth=1)
ada = AdaBoostClassifier(base_estimator=tree, n_estimators=500, learning_rate=0.1, random_state=1)

tree = tree.fit(x_train, y_train)
y_train_pred = tree.predict(x_train)
y_test_pred = tree.predict(x_test)

tree_train = accuracy_score(y_train, y_train_pred)
tree_test = accuracy_score(y_test, y_test_pred)
print("의사결정나무의 훈련정확도 / 테스트정확도 : %.3f / %.3f" % (tree_train, tree_test))

ada = ada.fit(x_train, y_train)
y_train_pred = ada.predict(x_train)
y_test_pred = ada.predict(x_test)

ada_train = accuracy_score(y_train, y_train_pred)
ada_test = accuracy_score(y_test, y_test_pred)
print("AdaBoosting의 훈련정확도 / 테스트정확도 : %.3f / %.3f" % (ada_train, ada_test))
[실행결과]

의사결정나무의 훈련정확도 / 테스트정확도 : 0.916 / 0.875
AdaBoosting의 훈련정확도 / 테스트정확도 : 1.000 / 0.917
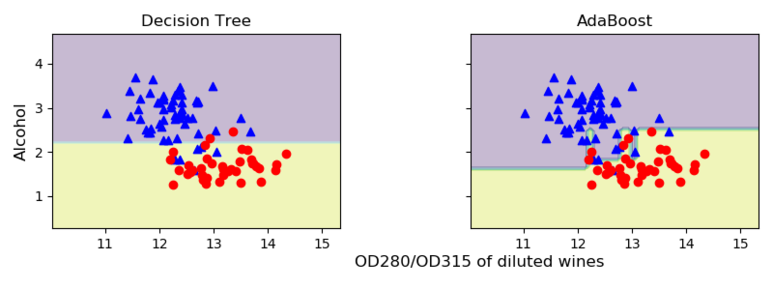
위의 실행결과를 통해 알 수 있듯이 깊이가 1인 의사결정나무의 경우에는 과소적합이라는 것을 알 수 있다. 훈련의 정확도에 비해 테스트의 정확도가 높은 편에 속하기 때문에 분산이 낮다는 것을 나타낸다. 반면 에이다부스트를 이용한 학습에서는 깊이가 1인 결정 트리에 비해 테스트 셋의 성능이 좀 더 높다. 또한 훈련 성능과 테스트 성능 사이에 간격이 크며, 이는 모델의 편향을 줄임으로서 추가적인 분산이 발생했다고 해석할 수 있다.
하지만 테스트셋을 반복적으로 사용해 모델을 선택하는 것은 좋은 방법이 아니며, 그에 대해서는 이 후 다른 장에서 설명할 예정이므로 우선은 여기서 마무리하자.
끝으로 결정 영역까지 확인해보자.
[Python Code]

import numpy as np
import matplotlib.pyplot as plt

x_min = x_train[:, 0].min() - 1
x_max = x_train[:, 0].max() + 1
y_min = x_train[:, 1].min() - 1
y_max = x_train[:, 1].max() + 1

xx, yy = np.meshgrid(
    np.arange(x_min, x_max, 0.1),
    np.arange(y_min, y_max, 0.1))
    f, axarr = plt.subplots(1, 2, sharex="col", sharey="row", figsize=(8, 3)
)

for idx, clf, tt in zip([0, 1], [tree, ada], ["Decision Tree", "AdaBoost"]):
    clf.fit(x_train, y_train)

    z = clf.predict(np.c_[xx.ravel(), yy.ravel()])
    z = z.reshape(xx.shape)

    axarr[idx].contourf(xx, yy, z, alpha=0.3)
    axarr[idx].scatter(
        x_train[y_train==0, 0],
        x_train[y_train==0, 1],
        c="blue",
        marker="^"
    )

    axarr[idx].scatter(
        x_train[y_train==1, 0],
        x_train[y_train==1, 1],
        c="red",
        marker="o"
    )

    axarr[idx].set_title(tt)
    axarr[0].set_ylabel("Alcohol", fontsize=12)

plt.text(10.2, -0.5, s="OD280/OD315 of diluted wines", ha="center", va="center", fontsize=12)
plt.tight_layout()
plt.show()
[실행 결과]
2) Gradient Boosting
앙상블에 이전까지의 오차를 보정하도록 예측기를 순차적으로 추가하는 기법으로 아다부스트처럼 반복이나 샘플의 가중치를 수정하는 것이 아니라, 이전 예측기가 만든 잔여 오차(잔차, Residual Error)에 새로운 학습기를 훈련 시킨다. 간단한 예제를 통해 확인해보자.
[Python Code]

from sklearn.tree import DecisionTreeRegressor
from sklearn.ensemble import GradientBoostingRegressor

from sklearn.datasets import make_moons
from sklearn.model_selection import train_test_split

import numpy as np
import pandas as pd
import matplotlib
import matplotlib.pyplot as plt

plt.rcParams['axes.labelsize'] = 14
plt.rcParams['xtick.labelsize'] = 12
plt.rcParams['ytick.labelsize'] = 12

# 한글출력
plt.rcParams['font.family'] = 'NanumBarunGothic'
plt.rcParams['axes.unicode_minus'] = False

np.random.seed(42)
X = np.random.rand(100, 1) - 0.5
y = 3*X[:, 0]**2 + 0.05 * np.random.randn(100)
tree_reg1 = DecisionTreeRegressor(max_depth=2, random_state=42)
tree_reg1.fit(X, y)

y2 = y - tree_reg1.predict(X)
tree_reg2 = DecisionTreeRegressor(max_depth=2, random_state=42)
tree_reg2.fit(X, y2)

y3 = y2 - tree_reg2.predict(X)
tree_reg3 = DecisionTreeRegressor(max_depth=2, random_state=42)
tree_reg3.fit(X, y3)

X_new = np.array([[0.8]])

y_pred = sum(tree.predict(X_new) for tree in (tree_reg1, tree_reg2, tree_reg3))
print(y_pred)

def plot_predictions(regressors, X, y, axes, label=None, style="r-", data_style="b.", data_label=None):
    x1 = np.linspace(axes[0], axes[1], 500)
    y_pred = sum(regressor.predict(x1.reshape(-1, 1)) for regressor in regressors)
    plt.plot(X[:, 0], y, data_style, label=data_label)
    plt.plot(x1, y_pred, style, linewidth=2, label=label)

    if label or data_label:
        plt.legend(loc="upper center", fontsize=16)

    plt.axis(axes)

plt.figure(figsize=(11,11))

plt.subplot(321)
plot_predictions([tree_reg1], X, y, axes=[-0.5, 0.5, -0.1, 0.8], label="$h_1(x_1)$", style="g-", data_label="훈련 세트")
plt.ylabel("$y$", fontsize=16, rotation=0)
plt.title("잔여 오차와 트리의 예측", fontsize=16)

plt.subplot(322)
plot_predictions([tree_reg1], X, y, axes=[-0.5, 0.5, -0.1, 0.8], label="$h(x_1) = h_1(x_1)$", data_label="훈련 세트")
plt.ylabel("$y$", fontsize=16, rotation=0)
plt.title("앙상블의 예측", fontsize=16)

plt.subplot(323)
plot_predictions([tree_reg2], X, y2, axes=[-0.5, 0.5, -0.5, 0.5], label="$h_2(x_1)$", style="g-", data_style="k+", data_label="잔여 오차")
plt.ylabel("$y - h_1(x_1)$", fontsize=16)

plt.subplot(324)
plot_predictions([tree_reg1, tree_reg2], X, y, axes=[-0.5, 0.5, -0.1, 0.8], label="$h(x_1) = h_1(x_1) + h_2(x_1)$")
plt.ylabel("$y$", fontsize=16, rotation=0)

plt.subplot(325)
plot_predictions([tree_reg3], X, y3, axes=[-0.5, 0.5, -0.5, 0.5], label="$h_3(x_1)$", style="g-", data_style="k+")
plt.ylabel("$y - h_1(x_1) - h_2(x_1)$", fontsize=16)
plt.xlabel("$x_1$", fontsize=16)

plt.subplot(326)
plot_predictions([tree_reg1, tree_reg2, tree_reg3], X, y, axes=[-0.5, 0.5, -0.1, 0.8], label="$h(x_1) = h_1(x_1) + h_2(x_1) + h_3(x_1)$")
plt.xlabel("$x_1$", fontsize=16)
plt.ylabel("$y$", fontsize=16, rotation=0)

plt.show()
[실행결과]

[0.75026781]
위의 코드를 실행하게 되면 아래와 같은 결과를 얻을 수 있다.
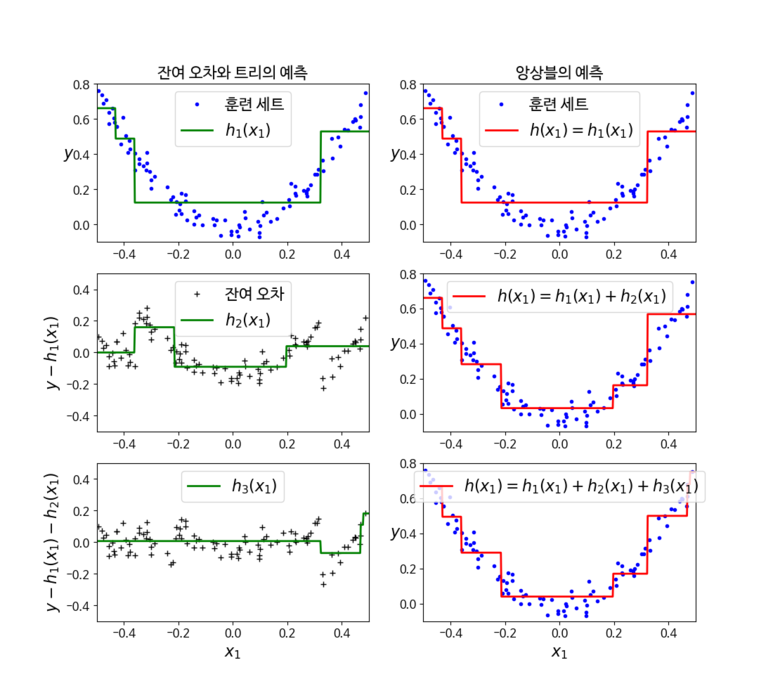
잠깐 시각화를 보게되면 왼쪽에 위치한 그래프들은 앙상블하기 전에 만들어놓은 의사결정나무 모델들이고 오른쪽에 있는 그래프들은 그래디언트 부스팅을 사용해 앙상블을 순서대로 했을 때의 분류 결과이다.
맨 처음에는 tree_reg1 만 생성이 되었기 때문에 앙상블을 적용 전과 후가 동일한 그래프로 나타나게 된다. 하지만 2번째 모델을 적용하는 것에서 부터 달라지게 되는데 왼쪽 그림중 2번째에 위치한 그래프는 첫번째 모델을 학습한 결과에 대한 잔차(잔여 오차)를 학습한 결과를 보여주는 것이며, 해당 내용을 앙상블로 적용한 결과가 오른쪽 두번째 그림이라고 할 수 있다.
마지막 그래프의 경우에는 두번째 모델을 학습한 결과에 대한 잔차를 학습하였고, 이를 앙상블 모델에 추가하여 학습한 결과이다.
이번에는 위에서 직접 코딩한 내용과 동일한 모델을 사용하여 학습해보자.
[Python Code]

gbrt = GradientBoostingRegressor(max_depth=2, n_estimators=3, learning_rate=1.0)
gbrt.fit(X, y)
y_pred1 = gbrt.predict(X_new)
print(y_pred1)
[실행결과]

[0.75026781]
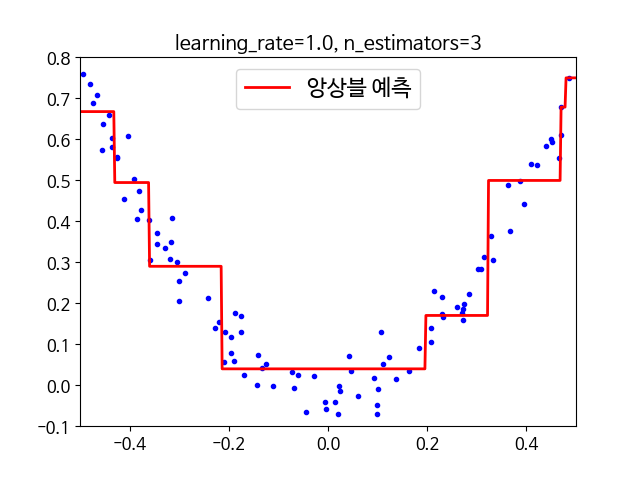
위 모델의 경우 앞선 모델과 유사하며, 차이점이 있다면 학습률을 설정해 줬다는 것에서 차이가 발생할 수 있다. 즉, learning_rate 매개변수가 각 트리의 기여 정도를 조절하며, 낮게 설정할 경우 예측을 위해 많은 의사결정나무가 필요하지만, 성능 자체는 좋아지는 경향이 있다.
앙상블 학습의 경우 개별 분류기에 비해 계산복잡도가 높아, 실전에서 사용할 경우 예측성능을 높이기 위해 계산 비용에 투자를 더 할 것인 지에 대한 트레이드 오프가 발생할 수 있으므로 사용 전에 가급적이면 우선순위를 따져 사용여부를 결정하는 것이 좋다.

댓글남기기